In March 2019 I wrote a blog post about a new sensortype for PRTG Network Monitor that allows users of this software to keep an eye on the CO₂ concentration of the atmosphere. My idea was to create more visibility for this important metric by adding this sensor to dashboards of the monitoring software PRTG.
Today an update of this sensor was published.
Why is the CO₂ level so important?
Life on earth and human civilization are at risk due to climate change. Although the details are rather complex there is in fact a simple linear (or “proportional”) relationship between the CO₂ content of the atmosphere and the global temperature. Doubling the CO₂ levels will make earth 2.9°-4.3°C warmer. We have already added 48% since the 1850s, which gives us 1.25°C warming, and we are currently adding another ~1% (=one percentage point) each year.
This linear relationship forces us to think about three brutal facts:
- It will continue to get warmer as long as we add even the tiniest bit of CO₂ to the atmosphere (just stopping emissions is not enough)
- Since there are various processes that we can’t fully decarbonize everything we need some kind of negative emissions to mitigate these hard-to-avoid emissions (otherwise we will never reach zero)
- When we reach zero emissions it will not get cooler unless we actively suck CO₂ out of the air.
We are now at 410-415 ppm, 48% more than in 1850, before the industrial revolution.
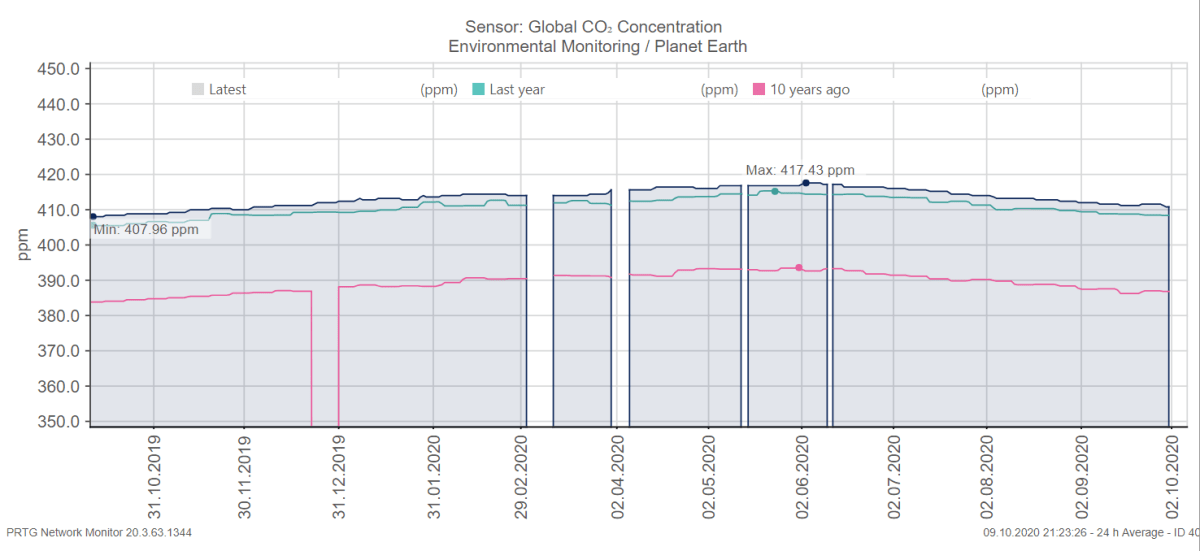
The following graph, created with PRTG, shows the daily measurements of CO₂ at the Mauna Loa Observatory located on a remote volcano in Hawaii for the last 12 months. It’s kind of the official fever curve of the planet.
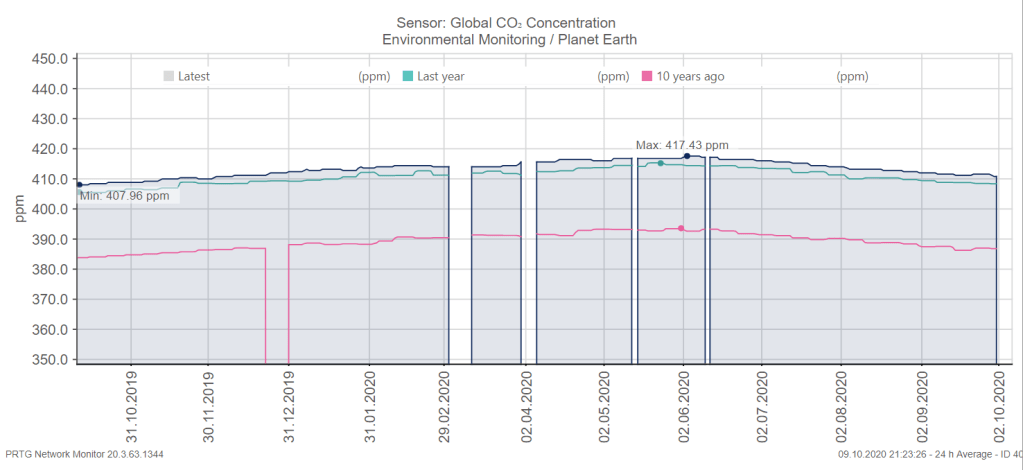
You can see that the concentration oscilates during the year. The peak is in late May/early June because that’s when spring ends on the big landmasses of Siberia and North America, the plants begin to grow again and take CO₂ out of the air (see here for a fascinating detailed explanation).
What’s much more important is the fact that the values for the last 12 months (gray/blue) are all higher than the values of the previous year (turquoise) and much higher than 10 years ago (red). This is us! We are pumping and burning 40 Gigatonnes of CO₂ into the atmosphere every year which increases this value which drives global temperatures up.
Values below 400 ppm, even better 350 ppm would be safe. But we are still increasing it. Please read “What is the problem?” on the website of my climate startup Carbon Drawdown Initiative if you want to know more.
Sensor Update
A few days ago the data source (link) of the sensor published in March 2019 was turned off, now the sensor uses another data source, the official numbers from NOAA Earth System Research Laboratories (National Oceanic and Atmospheric Administration, USA) (using this API Endpoint).
You can download the latest sensor code from PRTG Tools Family (click on GlobalCO2XML in the list). BTW: The data is updated once per day, so the sensor actually gets the data only once per day (to avoid overloading the API) and uses that result for the rest of the day, regardless of the sensor interval you choose.
How to install the sensor
Here is what you need to do to get this working in PRTG:
- Download the file globalco2xml.exe from the PRTG Tools Family website
- Copy the file into the EXEXML subfolder of your PRTG installation
- Create a new Custom EXEXML Sensor in PRTG and select the globalco2xml.exe file
When the sensor has been created select “Scan now” from its context menu twice (the first run will give back the value of 450 to set up the gauges properly, subsequent runs will return the actual current value).
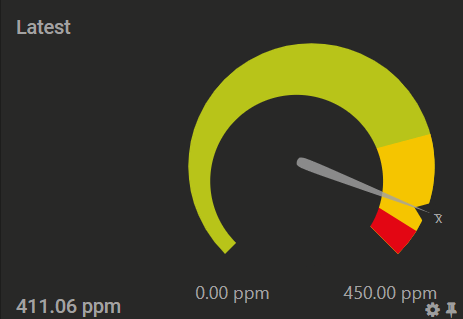
Now you have a global CO₂ sensor which you can put on your dashboards like I have it on my home dashboard:
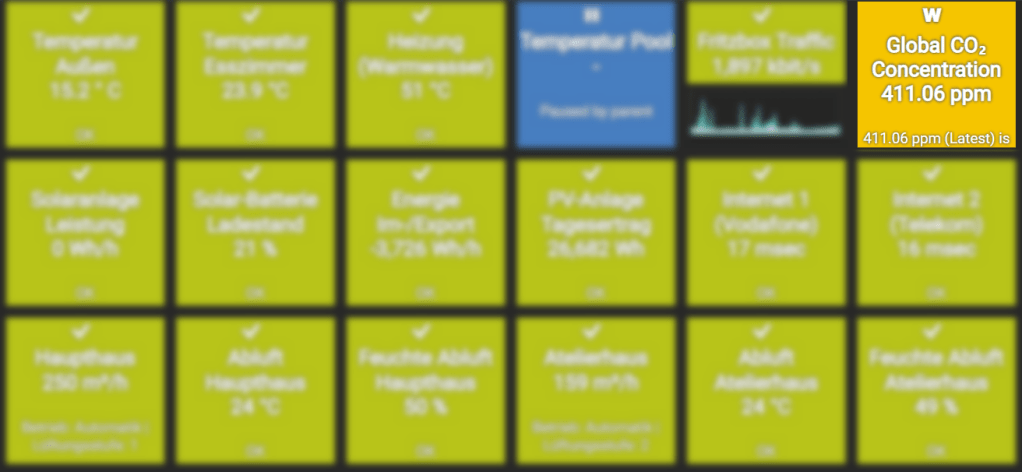
Please help lowering the CO₂ emissions!

You must be logged in to post a comment.